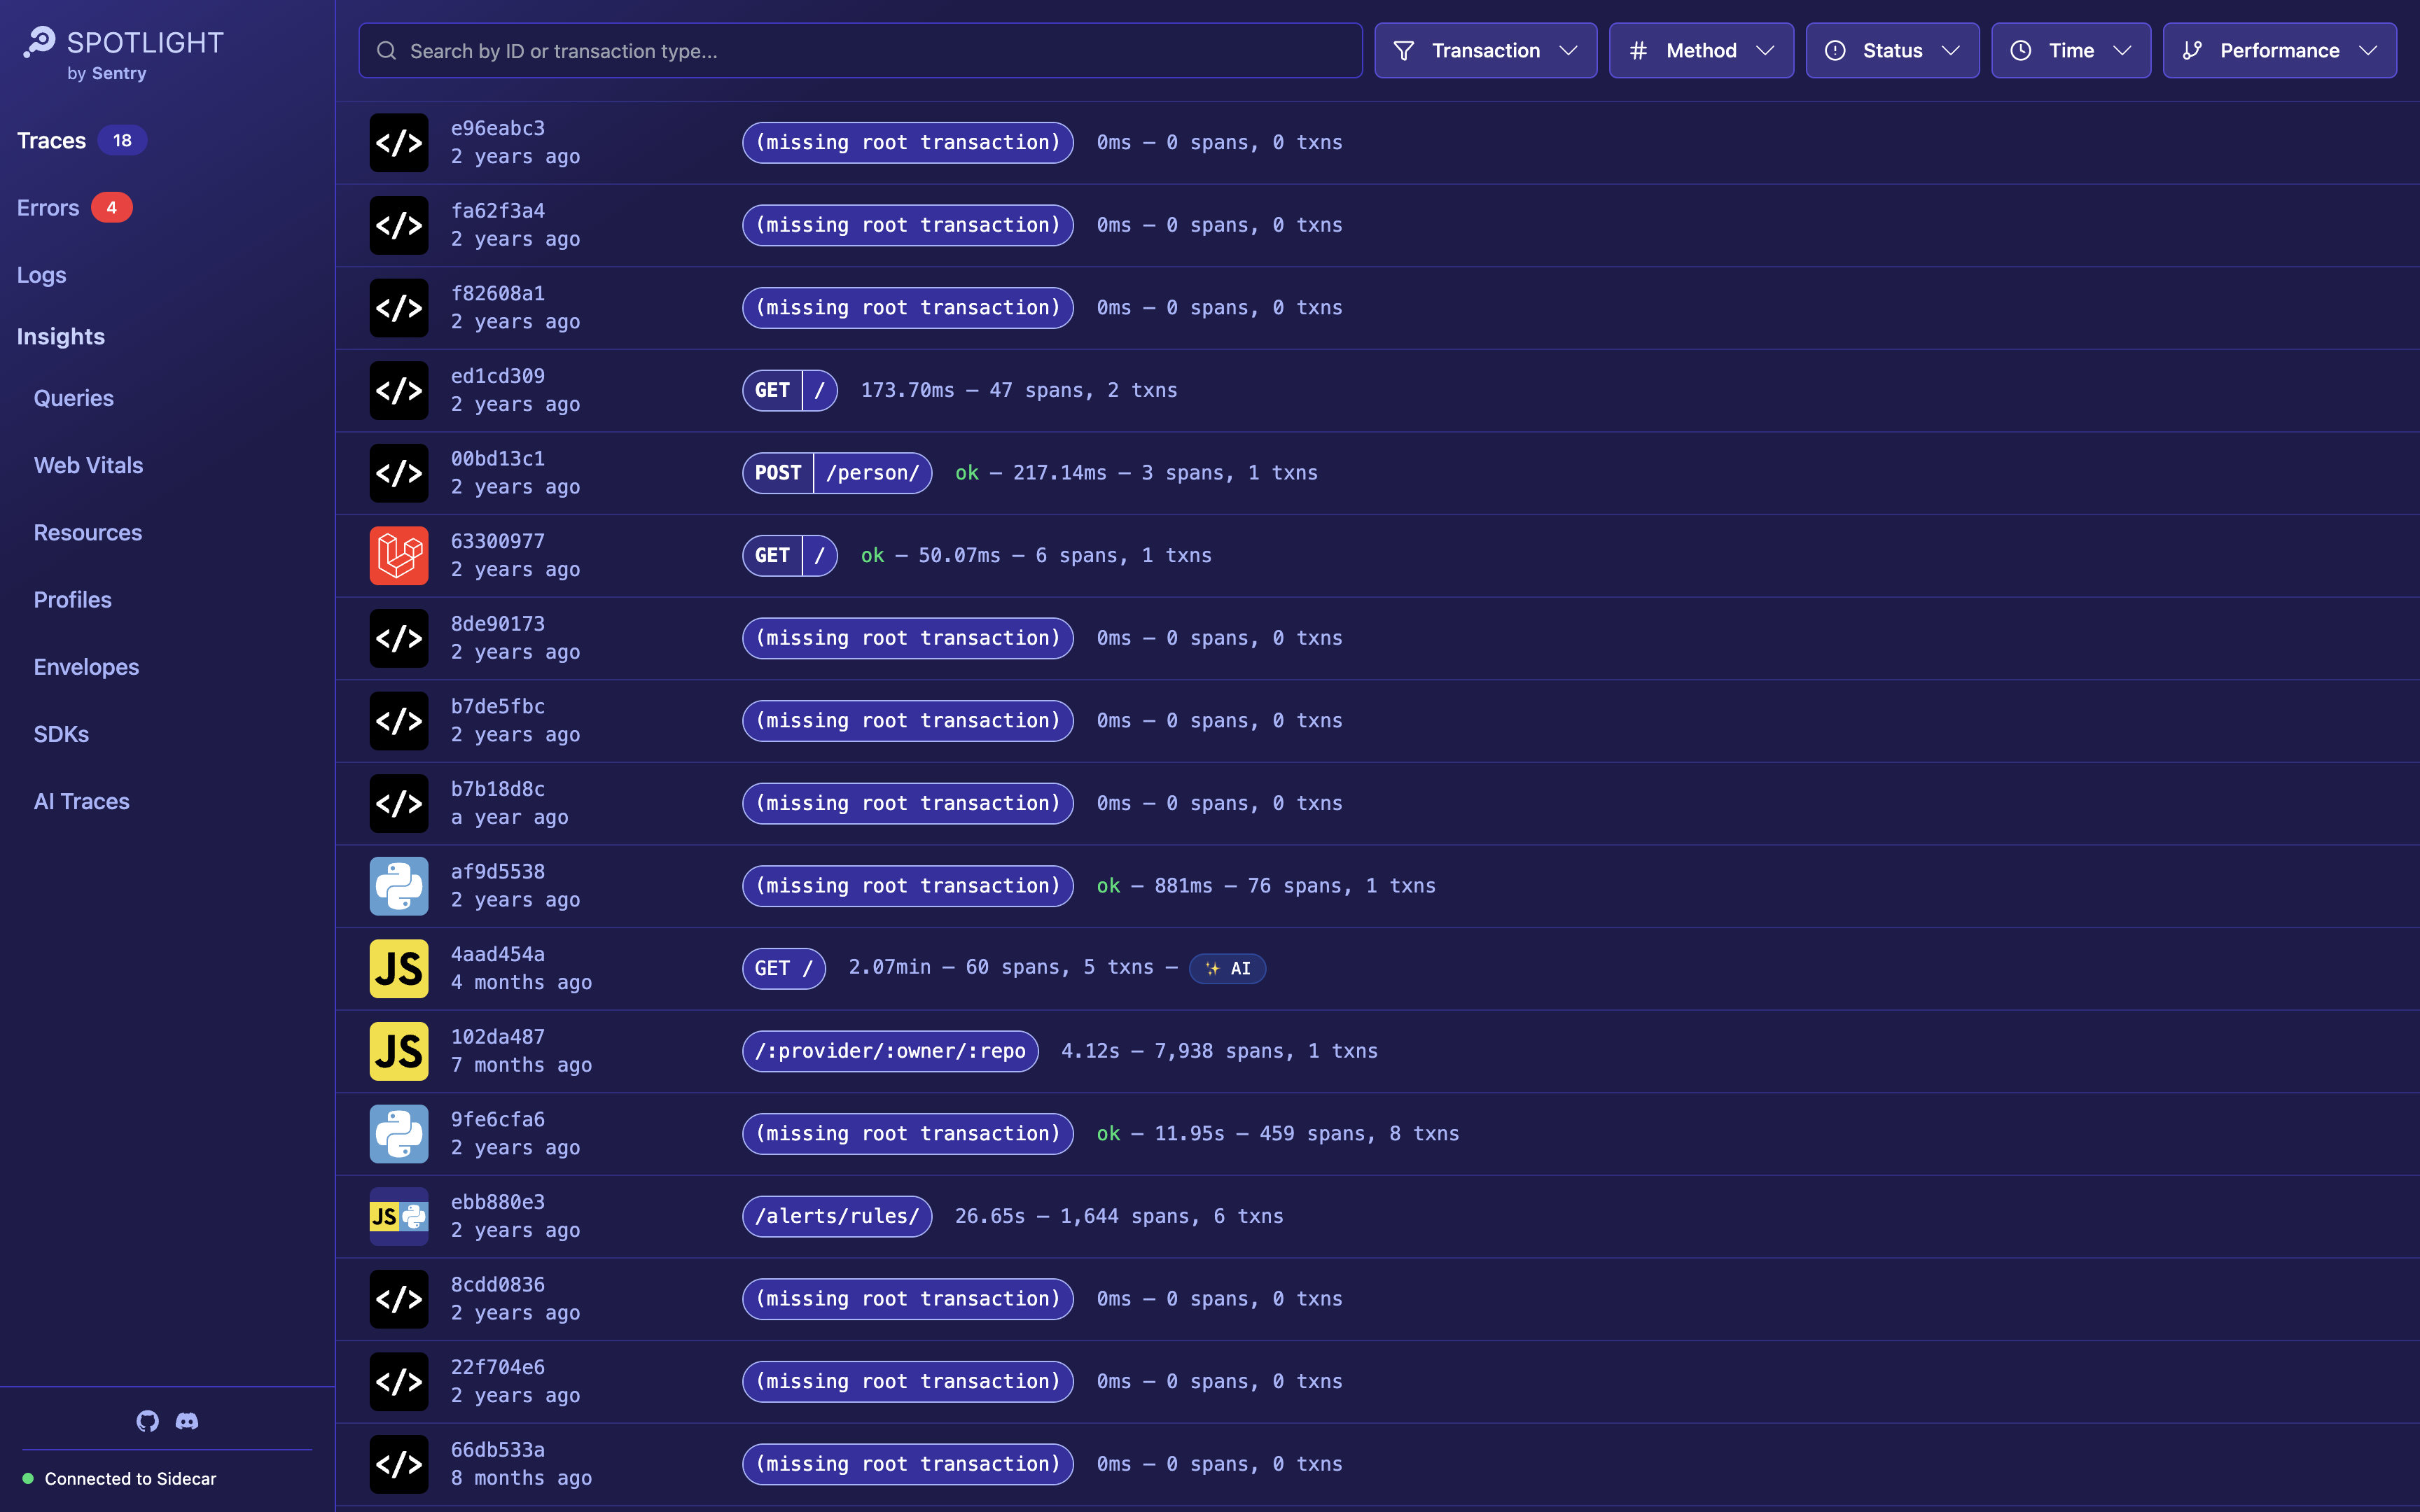
Get the context you and your AI agents need to ship better code faster
Real-time local errors, traces, and logs to your agent via MCP. Download our app when you want to jump in. powered by Sentry SDKs, supporting 100+ languages.
After installing the MCP server, you'll need to configure your Sentry SDK to enable Spotlight.
Get Started with Spotlight
Instructions below are for JavaScript/TypeScript but the logic is similar for other languages: Set spotlight to true, enable all features (especially logging), and make sure these are only done for development.
Install a Sentry SDK
If you don't have one already, install a Sentry SDK for your framework.
View Sentry Docs →Configure Sentry.init()
Add Spotlight to your Sentry configuration and enable all the features:
Sentry.init({
// your existing config
...(process.env.NODE_ENV !== "production" ? {
  spotlight: true, // Enable Spotlight
  sampleRate: 1.0, // Capture all errors in dev
  tracesSampleRate: 1.0, // Capture all traces in dev
  enableLogs: true,
  integrations: [
    Sentry.consoleLoggingIntegration({ levels: ["log", "warn", "error"] }),
    // For frontend apps, add:
    Sentry.spotlightBrowserIntegration(),
    Sentry.browserTracingIntegration(),
  ],
    }
  : {}),
});Install Spotlight App
Install our app for better human-debugging and visualization. It includes an AI view to inspect your AI applications, review all messages, tool calls, and more.

Powerful Features for Local Debugging
Everything you need to debug faster and ship with confidence
Real-time Error Tracking
Catch errors as they happen with instant notifications in your browser. No need to check logs or refresh pages.
Performance Tracing
Visualize the complete flow of your application with distributed tracing across frontend and backend.
Unified Console & Logs
Collect logs from all your services: frontend, backend, and everything in between. Capture console logs, warnings, and errors alongside your application events for complete, end-to-end debugging context.
AI-Assisted Debugging
Connect Spotlight to your AI coding assistant through MCP for intelligent error analysis and fix suggestions.
